Monitor your Raspberry Pi cluster with Prometheus
It is important to monitor remote servers to make sure you are not running out of compute resource/memory or disk space. It's even more important on a Raspberry Pi cluster where your resources are especially limited. A full SD card can knock a Raspberry Pi off your network or prevent services from working.

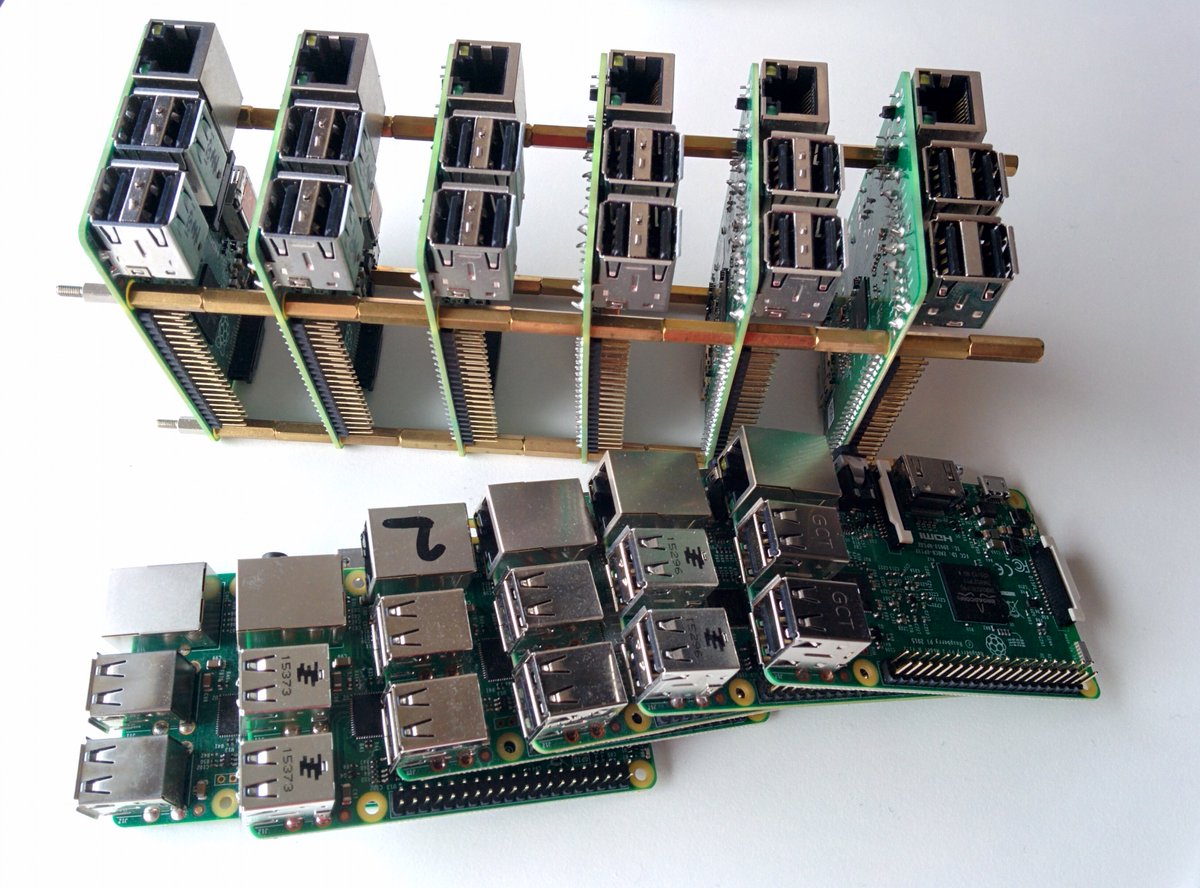
My Raspberry Pi collection - ready for Docker and Kubernetes tutorial writing.
Fortunately there is a native executable that works with the Prometheus time-series database called: Node Exporter. It gathers useful system information and makes it available for your time-series database.
If you'd like to learn about Prometheus follow my comprehensive guide:
Pre-reqs
- Docker installed on a PC/laptop
- One or more Raspberry Pis or ARMv6/v7 boards
These steps were tested on Raspbian Jessie Lite, but I would expect any Linux-based distro to work.
You can also apply the techniques in this article to monitoring cloud or homelab servers - just pick the "64-bit" download instead of one for ARM.
Setup NodeExporter
The NodeExporter project on GitHub has binary releases for 64-bit machines and ARM which means we just need to fetch the binary, unpackage it and start it up.
If you're using Raspberry Pi Zero, B or B+ use "ARMv6" for anything else use "ARMv7":
$ curl -SL https://github.com/prometheus/node_exporter/releases/download/v0.14.0/node_exporter-0.14.0.linux-armv7.tar.gz > node_exporter.tar.gz && \
sudo tar -xvf node_exporter.tar.gz -C /usr/local/bin/ --strip-components=1
Note: if you'd like to try a newer version, check the releases page
Now start it up:
$ node_exporter &
The easiest way to make this permanent is to add @reboot /usr/local/bin/node_exporter to your CRON file with crontab -e.
Enable cron with: sudo systemctl enable cron
If you want to start the service in a more resilient way then you can build up a systemd unit file.
Create: /etc/systemd/system/nodeexporter.service:
[Unit]
Description=NodeExporter

[Service]
TimeoutStartSec=0
ExecStart=/usr/local/bin/node_exporter

[Install]
WantedBy=multi-user.target
Then run:
sudo systemctl daemon-reload \
 && sudo systemctl enable nodeexporter \
 && sudo systemctl start node-exporter
Once running you will be able to browse to the Raspberry Pi's IP address on port 9100. Take a note of this URL because we will need to update our Prometheus config and tell it to scrape metrics later on.
Browse the available metrics:
$ curl localhost:9100/metrics | less
You can find out more about the metrics available on the NodeExporter homepage: NodeExporter
Once you have repeated the task on all your Raspberry Pis and taken note of their IP addresses move on to the next step.
Configure scrape endpoints
Prometheus scrapes metrics using a pull model meaning that your Raspberry Pis need to be accessible on the network from wherever you are running Prometheus.
The easiest way to run Prometheus is through Docker:
- Extract a default config file:
$ docker create --name prom_empty prom/prometheus
$ docker cp prom_empty:/etc/prometheus/prometheus.yml ./prometheus.yml
- Edit the scrape configs:
Use an editor and open up ./prometheus.yml
You should see a block like this:
scrape_configs:
  # The job name is added as a label `job=<job_name>` to any timeseries scraped from this config.
  - job_name: 'prometheus'

    # metrics_path defaults to '/metrics'
    # scheme defaults to 'http'.

    static_configs:
      - targets: ['localhost:9090']
Add to the block for each Raspberry Pi:
scrape_configs:
  - job_name: 'RPi1'
    static_configs:
      - targets: ['192.168.0.17:9100']
  - job_name: 'RPi2'
    static_configs:
      - targets: ['192.168.0.18:9100']
- Build a new Prometheus image with your config:
Dockerfile:
FROM prom/prometheus
COPY ./prometheus.yml /etc/prometheus/prometheus.yml
Build it:
$ docker build -t prometheus/cluster-local .
Run Prometheus
You can now run Prometheus. If you need to tweak the config make sure you build the image between removing and running the container a second time.
$ docker run -p 9090:9090 --restart=always --name prometheus-rpi -d prometheus/cluster-local
If you're already running Prometheus as part of the OpenFaaS stack or similar then change the port binding to 9091 instead with:
-p 9091:9090.
When you want to stop the container type in: docker rm -f prometheus-rpi.
Explore the metrics
- Check the targets
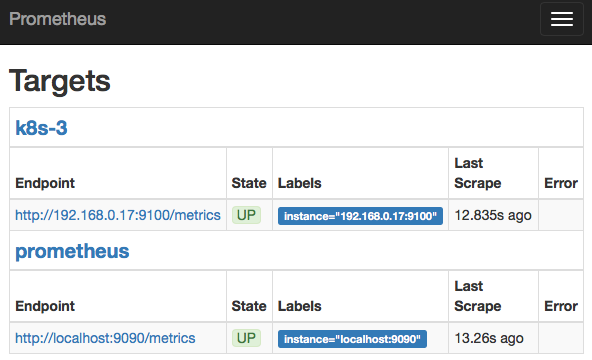
If everything worked correctly you will see a host under the "Status -> Targets" menu.

- Explore metrics
You can now open up the UI on the host where you started Prometheus by going to http://localhost:9090 and selecting one of the many metrics available.
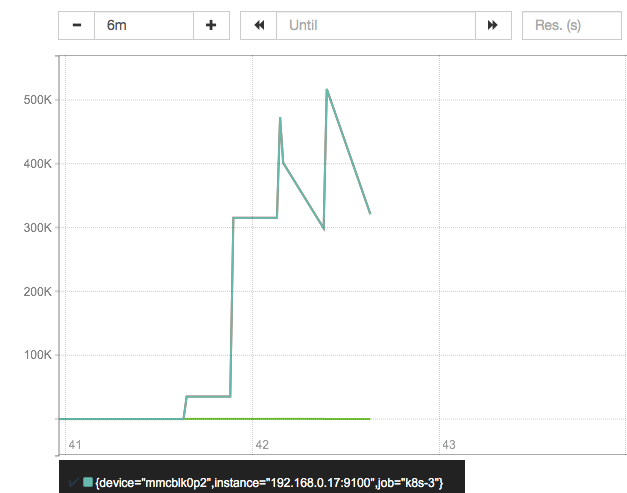
An example metric could be the amount of bytes read in from the disk. Normally on an idle system this will be around 0 bytes.
Type in the following expression:
rate(node_disk_bytes_read[1m])
Now head over the Raspberry Pi and type in:
$ find /; find /; find /
This will start reading every file and directory in the filesystem and generate some noise for our graph:

You can use the - / + icons to change the time window.
- Checkout network traffic
You can get an interesting readout of network traffic by typing in:
$ git clone https://github.com/alexellis/faas /tmp/faas
This will pull several tens of megabytes down from the Internet.
Use the query:
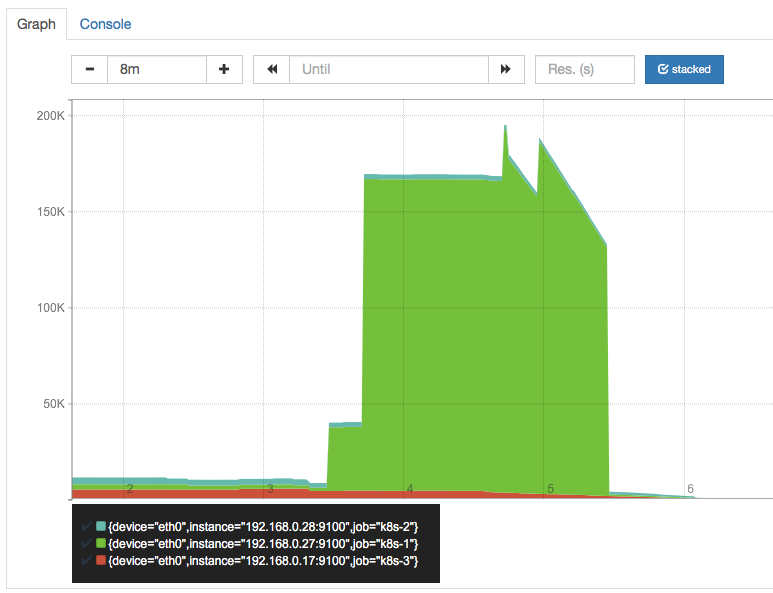
rate (node_network_receive_bytes{device="eth0"}[2m] )
Note on newer versions of NodeExporter this metric is called
node_network_receive_bytes_total.
At the beginning of the graph (for context) we see the base-line traffic used by Kubernetes (a container scheduler) and Prometheus when idle. We then initiated the git clone operation on a single host and saw a relatively large spike in traffic:

- Checking on disk space
You can get an estimate on gigabytes free on the root partition with a PromQL like this:
node_filesystem_free{mountpoint="/"}/1024/1024/1024
What about alerts?
Alerts can be generated by Prometheus and the AlertManager project. This means that you don't have to proactively check your graphs and can have a message come out to Slack, HipChat or a similar service which supports webhooks.
OpenFaaS uses AlertManager to auto-scale functions experiencing high load. Find out more at openfaas.com
Wrapping up
You can now monitor all of your Raspberry Pis - whether they are part of your cluster or just serving some other purpose in your home or office.
Serverless cluster
If you liked this blog post then head over to my post on Your Serverless Raspberry Pi Cluster with Docker.
Learn Prometheus
You can also read my in-depth tutorial on monitoring applications with Prometheus here.
Follow and share on Twitter, or join in the discussion:
Monitor your Raspberry Pi cluster with Prometheus and Docker @Raspberry_Pi @docker @PrometheusIO https://t.co/CVxO2SJvdZ pic.twitter.com/SBvtOQS72v
— Alex Ellis (@alexellisuk) September 19, 2017