Monitor your applications with Prometheus
In this hands-on guide we will look at how to integrate Prometheus monitoring into an existing application. Monitoring an application can give you insights into how it is being used and when. More importantly you can also pre-empt potential issues.
Key take aways:
- Learn techniques for monitoring applications and servers with Prometheus
- Run Prometheus in Docker
- Monitor and instrument a sample Golang application
- Understand how to deploy Prometheus with Docker stacks
- Get a quick-start with PromQL examples
 Prometheus is a leading cloud-native time-series database and monitoring solution. Pictured above is Julius Volz co-founder at the Docker Berlin Summit.
Looking for the quick-start sample code? Star or Fork it on Github here:
The Role of Exporters
Prometheus is a time-series database with a UI and sophisticated querying language (PromQL). Prometheus can scrape metrics, counters, gauges and histograms over HTTP using plaintext or a more efficient protocol.
Glossary:
When the /metrics endpoint is embedded within an existing application it's referred to as instrumentation and when the /metrics endpoint is part of a stand-alone process the project call that an Exporter.
Node exporter
One of the most widely used exporters is the NodeExporter. When NodeExporter is run on a host it will provide details on I/O, memory, disk and CPU pressure. You can run the NodeExporter as a Docker container, but it needs so many additional flags that the project recommends you run it directly on a host being monitored.
The built-in exporter
Prometheus provides its own set of metrics - in effect dog-fooding. This is built-in and is usually configured to be scraped (or collected) by default.
Community-supported exporters
An interesting exporter that was put together around Docker's Berlin summit is the Docker Hub and Github exporter by Edward Marshall. These exporters surface metrics from the Docker Hub or Github sites by querying APIs periodically and then relaying the values.
Ed used the Python client library to put together his exporter, but many other language bindings are available.
- Docker Hub exporter written in Python
One of the first Prometheus exporters I wrote was to monitor Bitcoin mining stats such as how many dollars I'd earned and how many solutions (hashes) per second my equipment was processing.
My Bitcoin exporter is written in Node.js and makes use of the Gauge and Histogram metric types.
- Bitcoin mining exporter in Node.js
Other exporters are highlighted in the docs such as MySQL, Mongo, Redis, NATS, Nginx and JenkinsCI (to name a few).
Building your own exporter
This is where things get really interesting - you can monitor almost anything. Imagine you ran a Shopify store (think: webstore-in-a-box) tracking both sales and order status.
Here are a few ideas for metrics you could include on a dashboard:
- top selling product
- top selling category
- total orders placed over time
- response time between placing and shipping an order
- total reviews
- average "star" rating on reviews
- how many sign-ups you've had
Now you may find that this kind of data is already available in which case maybe you just want to track lower-level metrics:
- database transactions processed
- payment gateway response time
- HTTP errors such as 403 and 404
- Geo-location of customers by IP address.
Let's first look at a simple Prometheus recipe with Docker and then come back to writing our own instrumentation for a sample app.
Getting Prometheus with Docker
Prometheus is written in Golang and can be consumed as single statically-compiled binary with no other dependencies. The project also packages up the binary with a sensible configuration in a Docker container.
Run Prometheus in Docker
Let's define a Docker Compose which will let us keep our command-lines simple and repeatable:
version: "3"
services:
  prometheus:
    image: quay.io/prometheus/prometheus:latest
    ports:
     - 9090:9090
Deploy the stack file:
Swarm mode is required to deploy stack files, so run
docker swarm initif you haven't already.
$ docker swarm init
$ docker stack deploy monitoring --compose-file=./docker-compose.yml
Navigate to: http://localhost:9090/ to view the UI.
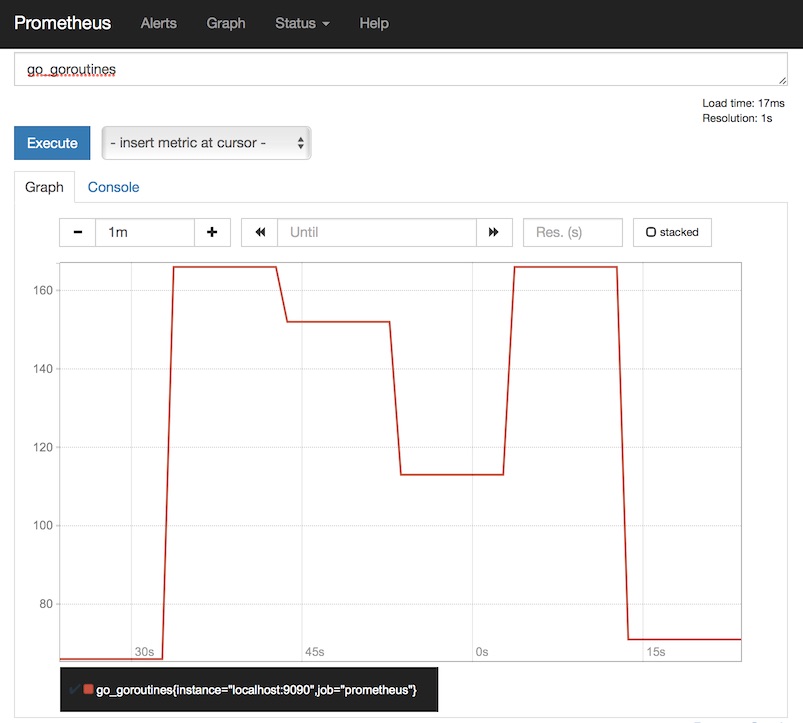
In the screenshot above you can see the amount of go_routines being used as recorded by Prometheus itself. To see the raw metrics Prometheus produces about itself open a browser and head over to http://localhost:9090/metrics
A
Go routineis a light-weight version of a thread, they're used in Golang to enable concurrency.
You may not want to monitor Prometheus, but the fact that batteries are included means you can get a feel for metrics from the get go.
Instrumenting an application
So let's look at instrumenting your own application.
There are two approaches to instrumentation, but both involve you exposing or implementing a HTTP/s endpoint. By default the endpoint is /metrics but can be configured in your prometheus.yml file. Prometheus will use this endpoint to scrape metrics at regular intervals such as every 5s or 30s.
Should I alter my application code?
You can make the /metrics endpoint part of your existing application's code. This means you already have the requisite secrets and credentials to interact with the your business/payment or database tiers. The downside is that you need to include a new library, endpoint and dependency into your product or project.
What is the other option?
It is also possible to write a separate process that acts as a shim to expose information from your application or environment. In the case of Ed's Docker Hub exporter he collates data from an external API which he has no control over. So if you're finding it hard to get approval to alter an existing application then this could be the way to go.
An advantage of a separate process is that you can update what you monitor without having to re-deploy your own application(s).
Implementing an endpoint:
There are two "exposition" formats that Prometheus can scrape from. Let's look at the output of the previous go_routines example by visiting http://localhost:9090/metrics
# HELP go_goroutines Number of goroutines that currently exist.
# TYPE go_goroutines gauge
go_goroutines 92
Use a client library
There are several libraries available for exposing metrics most of which can output text or the more efficient binary format (Protobuf) mentioned above.
The Golang, Java, Python and Ruby language bindings are maintained by the project, but many other open-source bindings are available too. Find a full list here:
Is it worth rolling your own?
The plain-text format is so simple that you can easily implement the protocol by following the Prometheus exposition formats. Before you roll your own make sure that you really can't make use of the tried and tested client libraries.
Instrument a Golang application
Let's create a simple application and instrument it directly with the Golang Prometheus library.
Use case:
We've been asked to write a web-service to provide SHA-256 hashes on demand, we want to know several things:
- How many requests we get for hashes
- How long each hash takes to compute on average
- How many 400 (bad request) errors we get
Fortunately we can achieve all of the above through the use of a Histogram metric, but the easiest example is the counter (always goes up or stays the same) of gauge (like a counter, but can go up or down).
Read up on Metric Types
The complete code including a Dockerfile is available on Github: alexellis/hash-browns
Here's a sample of the "server.go" file:
func main() {
	histogram := prometheus.NewHistogramVec(prometheus.HistogramOpts{
		Name: "hash_duration_seconds",
		Help: "Time taken to create hashes",
	}, []string{"code"})

	r := mux.NewRouter()
	r.Handle("/metrics", prometheusHandler())
	r.Handle("/hash", hashHandler(histogram))

	prometheus.Register(histogram)

	s := &http.Server{
		Addr:           ":8080",
		ReadTimeout:    8 * time.Second,
		WriteTimeout:   8 * time.Second,
		MaxHeaderBytes: 1 << 20,
		Handler:        r,
	}
	log.Fatal(s.ListenAndServe())
}
Here we register our application route and the metrics route.
Then recording time taken is simply a case of calling histogram.Observe(seconds).
start := time.Now()

// Do something

duration := time.Since(start)
code := 200 // some HTTP Code
histogram.WithLabelValues(fmt.Sprintf("%d", code)).Observe(duration.Seconds())
You can generate a hash like this:
$ curl localhost:8080/hash -d "my_input_value_here"
49b8c4256d603a68ee9bcd95f8e11eed784189bd40c354950014b6d7f7263d6c
This will now show up if we curl localhost:8080/metrics .
# HELP hash_seconds Time taken to create hashes
# TYPE hash_seconds histogram
hash_seconds_bucket{code="200",le="1"} 2
hash_seconds_bucket{code="200",le="2.5"} 2
hash_seconds_bucket{code="200",le="5"} 2
hash_seconds_bucket{code="200",le="10"} 2
hash_seconds_bucket{code="200",le="+Inf"} 2
hash_seconds_sum{code="200"} 9.370800000000002e-05
hash_seconds_count{code="200"} 2
The final step is to edit your prometheus.yml file and start scraping the new application code. You will then find the metric in the list on the drop-down and can plot the values.
Putting it all together
We need to edit the Prometheus config, here's a trick to extract the default config from the official Docker image:
$ docker run --entrypoint='' -ti quay.io/prometheus/prometheus:latest /bin/cat /etc/prometheus/prometheus.yml > prometheus.yml
Now edit the prometheus.yml file created in your current directory. In the scrape_configs section add the following:
  - job_name: 'hashbrowns'

    # metrics_path defaults to '/metrics'
    # scheme defaults to 'http'.
    static_configs:
      - targets: ['hashbrowns:8080']
Docker Swarm enables services to reach each other through embedded DNS, so the target is just the label ("hashbrowns") from the compose file.
Now create a new docker-compose.yml file:
version: "3"
services:
  prometheus:
    image: quay.io/prometheus/prometheus:latest
    ports:
     - 9090:9090
    volumes:
     - "./prometheus.yml:/etc/prometheus/prometheus.yml"

  hashbrowns:
    image: alexellis2/hash-browns
    ports:
      - 8080:8080
Deploy the stack file:
$ docker stack deploy tutorial --compose-file=./docker-compose.yml
Note: Addressing the service by name will function well as long as you have only one replica, if you decide to scale the service then you will need to look into more letting Prometheus discover all the replicas separately.
Here's what it will look like in the Prometheus UI:
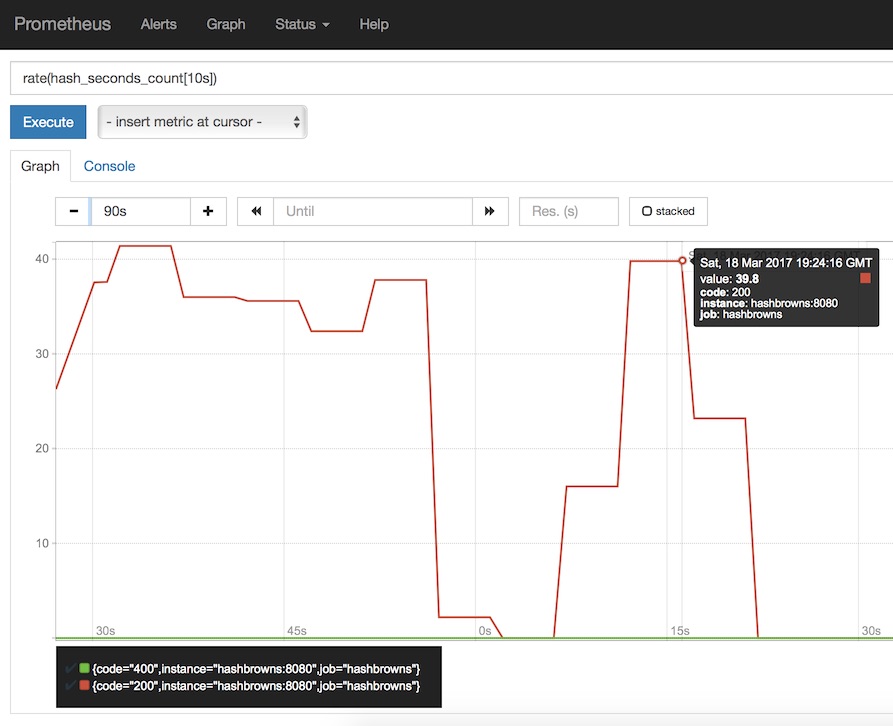
Let's now give answers in PromQL format for the metrics we wanted to collect above. It took me some time to get used to PromQL, but fortunately Julius has written a very detailed article available here.
- Answer: How many requests we get for hashes
The following PromQL statement gives the rate of increase for our hash function over a 1 minute window. This window can be smaller, but it needs to cover at least the two samples.
rate(hash_seconds_count[1m])
- Answer: How long each hash takes to compute on average
For the average execution over the last 5 minutes type in:
rate(hash_seconds_sum[5m]) / rate(hash_seconds_count[5m])
- Answer: Show how many 400 (bad request) errors we got over the last 5 minutes
rate(hash_seconds_count{code="400"}[5m])
Special thanks to Julius Volz for proof-reading and making suggestions for edits.
Wrapping up
Wrapping up, we've gone from no metrics to instrumentation in a very short period of time.
Become an insider
You can become an insider and get insider updates on all of my work with OSS, blogs, links, tweets, videos, events and new features for OpenFaaS. You can become an insider by sponsoring me on GitHub from 5 USD / mo.
Don't miss the next update, sponsor me on GitHub today.
Share, star or fork
Fork or star the sample Github repository and start building your own dashboard:
Share this guide and follow me on Twitter @alexellisuk.
Get hands-on with this @PrometheusIO guide to surface insights from your applications and infrastructure #docker https://t.co/2I0icBIDaC pic.twitter.com/90tZ5VRvbu
— Alex Ellis (@alexellisuk) March 20, 2017
Enjoyed the tutorial? 🤓💻
Follow me on Twitter @alexellisuk to keep up to date with new content. Feel free to reach out if you have any questions, comments, suggestions.
Hire me to help you with Kubernetes / Prometheus / Cloud Native
Hire me via OpenFaaS Ltd by emailing sales@openfaas.com, or through my work calendar.
Keep learning:
- Does this work on an ARM device or Raspberry Pi?
Yes, I have a Docker image (alexellis2/prometheus-armhf:1.5.2) available on the Docker Hub for Prometheus and the AlertManager (alexellis2/alertmanager-armhf:0.5.1) project.
Update 5th June 2019: The Prometheus project finally has multi-arch Docker images, meaning that
prom/prometheus:latestnow corresponds to the latest and greatest version on Raspberry Pi, PC and 64-bit ARM.
-
Read my tutorial on Docker Stacks and attachable networks
-
Checkout Prometheus in action with my serverless / Functions as a Service project on Github alexellis/FaaS