Solar logging
Logging enabled with Raspberry PI and Arduino
After calibrating the power supply to a voltage of 4.86v I was able to use a simple voltage divider with two equal impedance resistors to measure the voltage from my two panels.
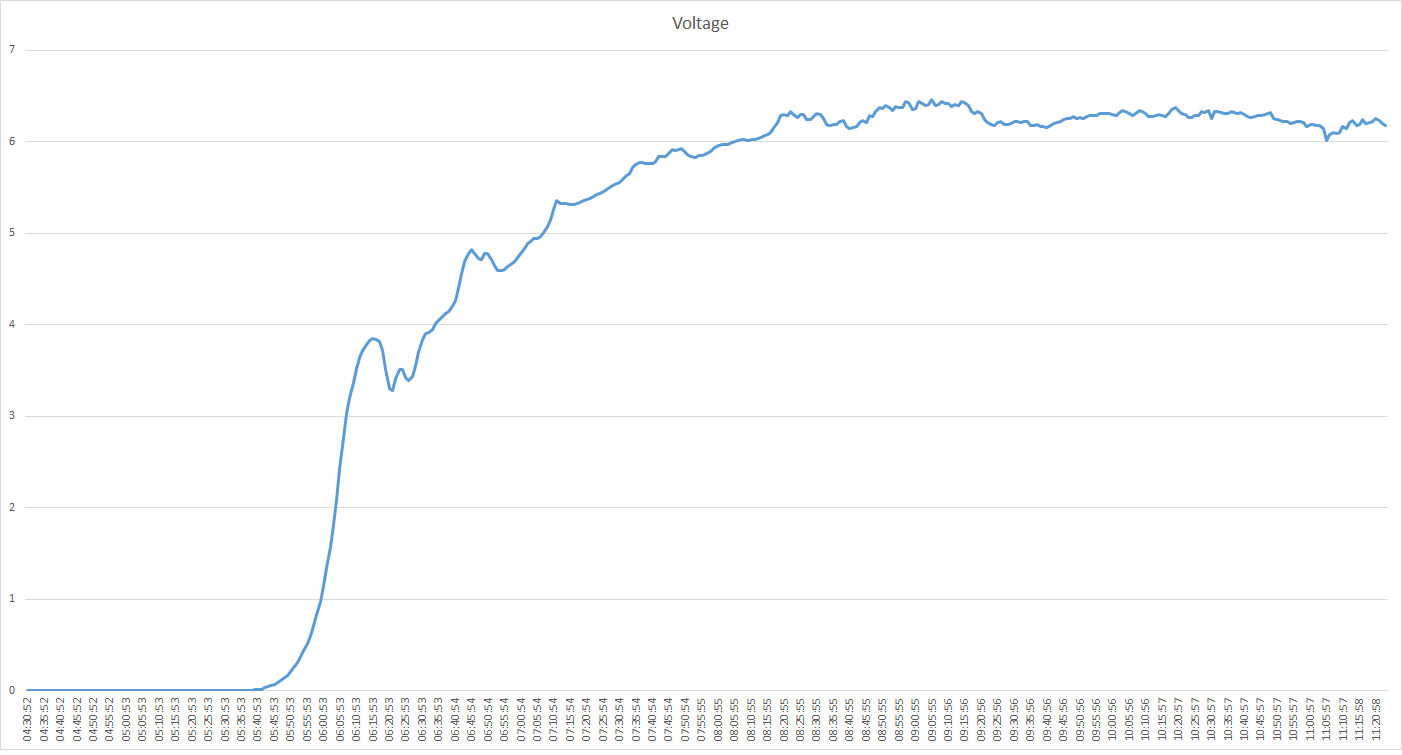
This basic line graph plotted with Excel shows the data starting at 4AM and ramping up exponentially. It smooths off at around 9.30am where the sun starts to change its angle.
The code
After including the pyserial module with easy_install I wrote this code to parse the output of my Arduino. It smooths out n samples before logging to a file.
Example: Usage: python volt_read <file.txt> <samples>
import serial
from datetime import datetime
import sys

class writer:
        def __init__(self,filename):
                self.format='%Y-%m-%d %H:%M:%S'
                self.filename=filename
        def get_stamp(self):
                return datetime.now().strftime(self.format)
        def write_stamp(self, voltage):
                val = self.get_stamp() + "\t" + str(voltage) +'\n'
                print val
                open(self.filename, 'a').write(val)

def setup():
        ser = serial.Serial('/dev/ttyUSB0', 9600)
        return ser

if __name__ == '__main__':
        if len(sys.argv)<2:
                print "need argument of <file path> <samples>"
                quit()
        ser=setup()
        writer1=writer(sys.argv[1])
        readings =0
        total=0.0
        samples=int(sys.argv[2])

        while 1 :
                val = ser.readline()
                val =val.rstrip()
                if val.startswith('Voltage'):
                        print "Reset"
                else:
                        print '\''+val+'\''
                        valIndex = val.find('-')
                        floatVal= float(val[(valIndex)+2:])
                        readings=readings+1
                        total =total+floatVal
                        if readings == samples:
                                voltage = total /readings
                                writer1.write_stamp(voltage)
                                #print float(voltage)
                                readings=0
                                total=0
Example raw data
This is read from the text file output by the python program.
2015-03-13-06:23:53     3.51316666667
2015-03-13-06:24:53     3.50966666667
2015-03-13-06:25:53     3.42983333333
2015-03-13-06:26:53     3.39016666667
2015-03-13-06:27:53     3.4355
2015-03-13-06:28:53     3.5545
2015-03-13-06:29:53     3.71
Taking it further
- Include current sensor or shunt resistor to measure power generated - this is much more interesting than voltage because the panel will generate around full voltage even in dim lighting.
- Automatically calibrate the power source to give accurate readings whatever is powering the device.
- Log additional data such as temperature of the panel and consider how this affects the output
- Put the panel/measuring setup in the garden in various places.