Solar logging part II
This is the second post on solar voltage logging. In part one I mentioned how I used a small Arduino nano clone and resistor divider to read the voltage produced by my hobby-grade photovoltaic panels.
Today's solar graph
Power starts registering at 5:40am and peaks at 7:07am before taking a dive and then only really recovering around lunch time. This lined up closely with the weather as experienced, a dark dull start to the day and then sun and blue skies after midday.
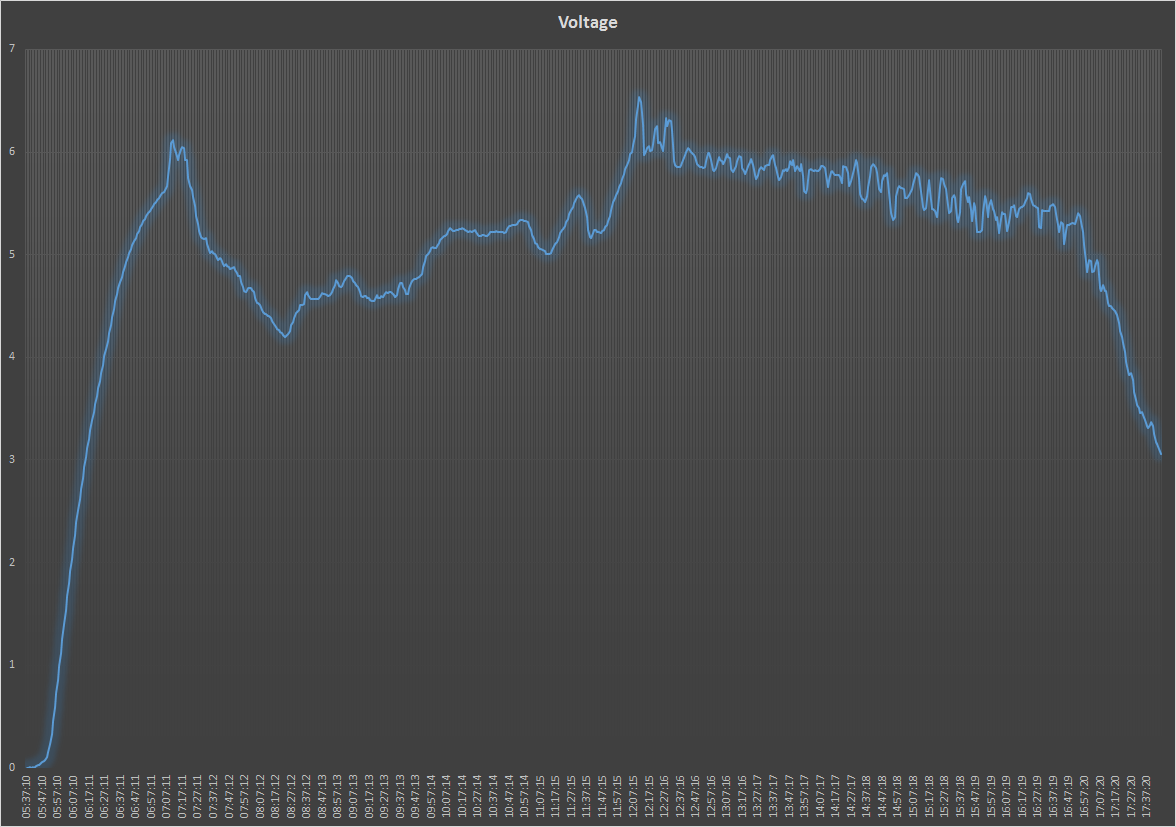
The line graph was created in Excel. I have also included the Max/Min and Avg voltage. NB: these figures include a -0.2v drop in voltage after passing through a Schottky diode in series with the panel.
- Max 6.53
- Min 0.000166667
- Avg 4.99
Previous solar experiment
I had a small solar array running in my back garden today which I built several weeks ago while impatiently waiting for my larger PVs to arrive. It consists of 12 PV cells recycled from solar garden lights costing £8 in total.
Each two adjacent PV cells are connected in series then all the pairs are all connected in parallel, in the bright sun I was seeing a maximum voltage of around 6.7v and up to 85mA of current. If P = IV, then 6.6v * 0.085ma = 0.56w. To put this into context, I just bought a 6V / 3.5w PV for £4.20.

I was using it to trickle charge 4 AA batteries in a holder.