Create an Environmental Monitoring Dashboard
Create your very own environmental monitoring dashboard with Docker and the Raspberry Pi.
At Dockercon 2016 I saw InfluxDB working in harmony with Grafana and new I needed to try it as soon as possible.
Grafana's UI is crisp and pleasingly dark - kind of like Sublime Text for dashboarding. InfluxDB is a time-series database ideal for recording measurements.
Pimoroni had kitted me out with half a dozen environmental monitoring add-on boards for Dockercon so I set about writing a simple dashboard for collecting data in my house. I started with one sensor and added more once I had everything tuned-in.
This is my version pic.twitter.com/YlRjuLMfBk
— Alex Ellis (@alexellisuk) September 2, 2016
I've now been collecting data since the beginning of August and can see a definite change in the weather!
Introduction
In Part 1 we'll use Docker to load up a Grafana and InfluxDB instance.
- Log into a PC/Laptop or cloud instance.
- Create a
docker-compose.ymlfile to setup a new dashboard with InfluxDB and Grafana.
Then in Part 2 we'll configure each of our Raspberry Pis to push regular sensor readings to InfluxDB through Python.
- Set up Pimoroni's environmental sensor board
- Run a Python script to submit sensor readings
Part 1
1.1 Bill of materials
- Raspberry Pi (any with 40-pin header) and network adapter
- Pimoroni enviro-pHAT sensor board or Adafruit BME280
- Regular machine or cloud instance running Docker
1.2 - InfluxDB & Grafana
Before we begin collating sensor data we will need somewhere to store the measurements then another tool to display them.
InfluxDB provides a time-series database which accepts SQL-style queries and plugs into various dashboards
Grafana is a dashboard tool used to monitor anything that can be measured. It is often paired up with Prometheus as a back-end to display the health of containers and clusters. You can combine various datastores such as InfluxDB, Prometheus or any other JSON based HTTP endpoint as long as it conforms to a time series.
Docker Compose gives us a way to launch our database and dashboard together on our PC. The docker-compose.yml file is also provided in the Github repository: alexellis/enviro-dashboard.
version: "2.0"
services:
  influx:
    image: influxdb
    ports:
     - "8083:8083"
     - "8086:8086"
    environment:
     - INFLUXDB_USER=root
     - INFLUXDB_PASS=root
     - INFLUXDB_NAME=environment
     - PRE_CREATE_DB="environment"
  grafana:
    image: grafana/grafana
    environment:
     - INFLUXDB_USER=root
     - INFLUXDB_PASS=J*E2<PTJcNc4
     - INFLUXDB_NAME=environment
    ports:
     - "3000:3000"
    links:
     - influx
    depends_on:
     - influx
docker-compose.yml
You should now be able to connect to your Grafana dashboard on port: 3000 or at http://localhost:3000/ if you're on Docker for Mac/Windows.
If you want to use the influx client tool to explore its CLI or data you collect later on then type in:
$ docker run -ti --net stats_default influxdb influx -host influx
Let's create an initial database with the CLI:
Visit https://enterprise.influxdata.com to register for updates, InfluxDB server management, and monitoring.
Connected to http://influx:8086 version 0.13.0
InfluxDB shell version: 0.13.0

> create database environment

> show databases
name: databases
---------------
name
_internal
environment
>
This step can also be automated through the InfluxDB API or a client library.
1.3 - Create an initial dashboard
We're now going to create an initial dashboard by running-in a json file I created earlier through the Grafana UI. We will use curl in a bash script to create a datasource for InfluxDB and then create the dashboard afterwards. You could also do this manually through the UI.
At the time of writing there doesn't seem to be a better way of automating this initial setup.
./add_datasource.sh
./add_dashboard.sh
You can now login to your dashboard as 'admin/admin' at: http://localhost:3000/
Part 2
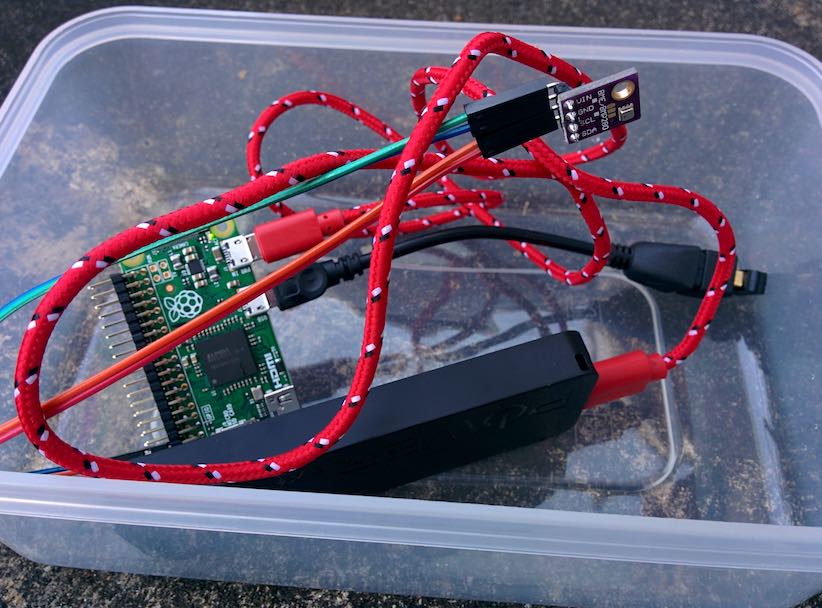
This cheap lunchbox and battery pack let me run the data logger outdoors for around 12 hours, even through a freezing night.
In part 2 I will show you some code that uses the InfluxDB client API in Python to submit measurements at a regular interval. After that we'll create a set of graphs to display the data.
2.1 Preparing the Pi
Let's run the Python code inside Docker so that we don't have to install dependencies on the Pi.
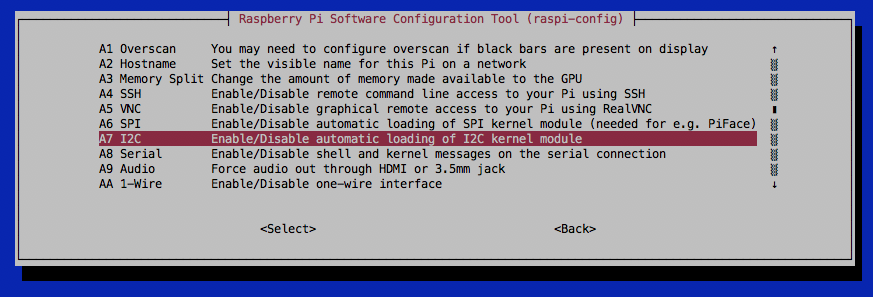
- Enable i2c
Type in raspi-config and go to advanced options, then "Enable i2c" - this enables the Pi to talk to the Envirophat and other sensor boards.
- Install Docker
If you haven't already then type in curl -sSL get.docker.com |sh and wait for Docker to install.
Dockerfile
Here's an initial Dockerfile for the Envirophat to be found in the logger directory of the repo.
I also have a version available for the BME280 sensor which is very similar but also features a humidity sensor in the bme280_logger directory.
FROM alexellis2/python2-gpio-armhf:2
RUN pip2 install envirophat
ADD ./monitor.py ./monitor.py
View the Python code here
At runtime just pass environmental variables for all the parts you need:
PI_HOST- the name of the data loggerSAMPLE_PAUSE- time in seconds to pause between samplesINFLUX_HOST- the remote machine running InfluxDB
Now build the Docker image and run it to start logging data. To pass environmental variables just type in something like the following with multiple -e arguments.
docker run -e PI_HOST=shed -e SAMPLE_PAUSE=15 -d <imagename>
2.2 View your graph
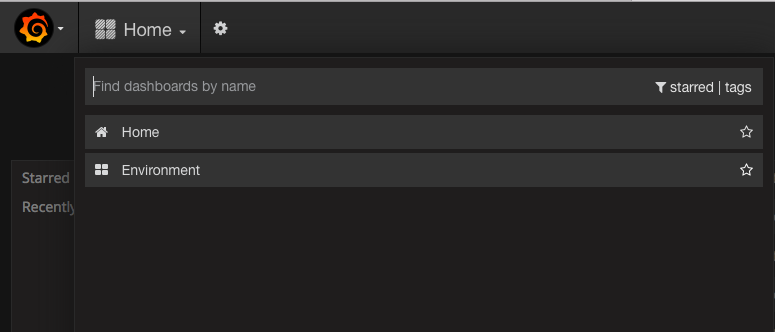
Log into Grafana as admin/admin on http://localhost:3000 or wherever you are hosting the site. You should already see the dashboard we created earlier when running add_dashboard.sh.
If you have any issues with either of the scripts then you can upload the dashboard.json file manually and create the datasource entry like this:
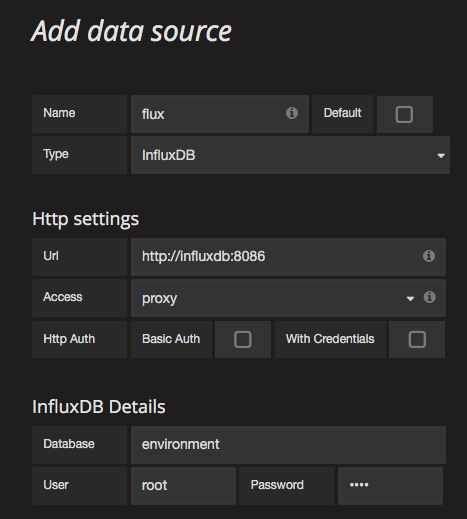
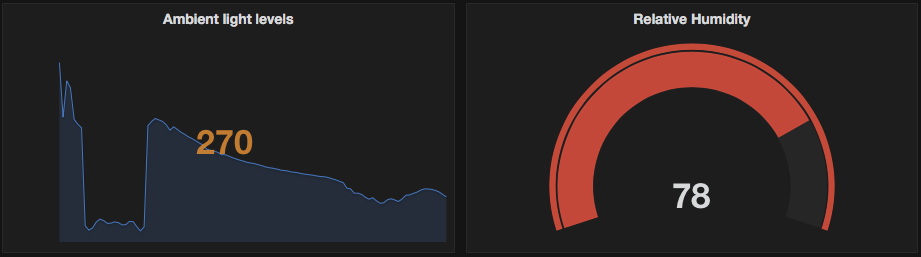
From here you will be able to create new Dashboards and add gas-bars, gauges and other cool visualizations like sparkles using the "singlestat" view.
Wrapping up
Share your own data logger or environmental monitoring dashboard on Twitter @alexellisuk.
-
Star/fork the repository alexellis/enviro-dashboard
-
Read my series on Docker
-
Check out my Hands-on Raspberry Pi and Docker video